State of UK construction 2013
It's easy to get confused by monthly figures and short-term trends. Here we take the long view, assessing construction output now compared to the last ten years.
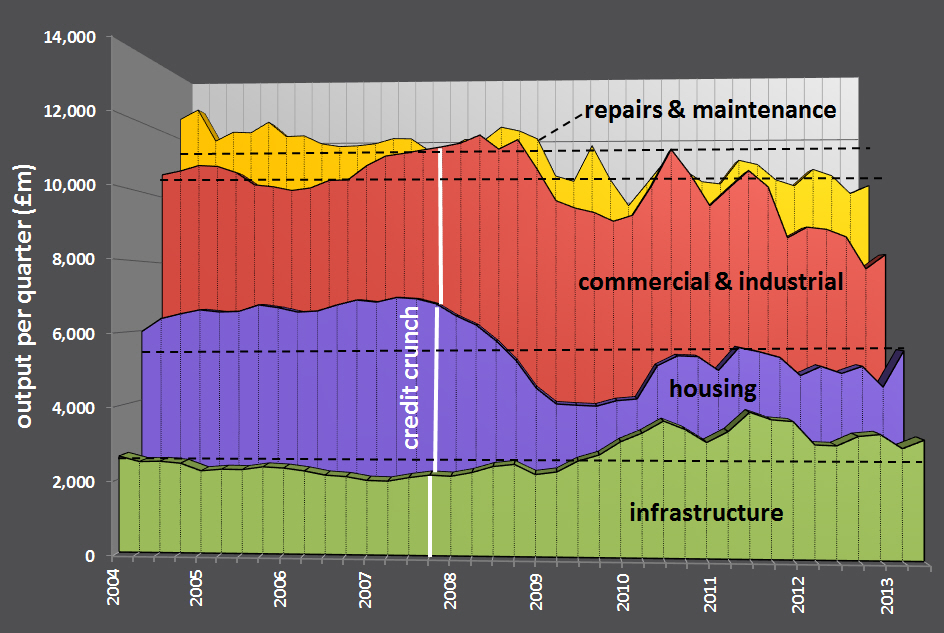
The graph below is based on the chained volume measure of construction output in Great Britain: 2010 prices, non-seasonally adjusted - by sector, published by the Office for National Statistics on 9 August 2013. The dotted lines indicate the average output for each area over the last 10 years.
Whilst each area has shown some recovery in the last quarter, the overall picture is still 9% below the 10 year average and 16% below the 10 year peak.
New infrastructure works continue to prop up the industry, with output 18% above the ten year average, although with the post-credit crunch stimulus in decline, new infrastructure works are now 18% lower than their 2011 peak.
Housing has shown a dramatic increase in the last quarter, returning almost to its average level, although it remains 21% below its pre credit crunch peak.
Commercial and industrial construction remains 20% below the ten year average, despite gains in the last quarter, and repairs and maintenance are 9% below the ten year average, continuing what appears to be a long-term decline.
Overall, there are reasons for optimism, but there is a long way to go.
BIM Directory
[edit] Building Information Modelling (BIM)
[edit] Information Requirements
Employer's Information Requirements (EIR)
Organisational Information Requirements (OIR)
Asset Information Requirements (AIR)
[edit] Information Models
Project Information Model (PIM)
[edit] Collaborative Practices
Industry Foundation Classes (IFC)


Comments
To start a discussion about this article, click 'Add a comment' above and add your thoughts to this discussion page.